
Condition review
Record symptoms, alarms, load conditions and inspection history before deciding what to replace.
SOLUTIONS / APPLICATION GUIDE
Prepare shutdowns and replacement decisions with a clear asset record. Compare motor energy costs and bring fault evidence to the maintenance conversation.
Enable JavaScript for interactive estimates or ask our engineering team.
CHOOSE YOUR APPROACH
Record symptoms, alarms, load conditions and inspection history before deciding what to replace.
Define isolation boundaries, permits, spares, tests and the return-to-service sequence.
Compare condition, compatibility, downtime, energy use and supportability.
BUILD A USEFUL BRIEF
Maintenance should be planned around approved isolation and a competent risk assessment. A website estimate never authorises live work.
COMPONENTS THAT COMPLETE THE APPLICATION
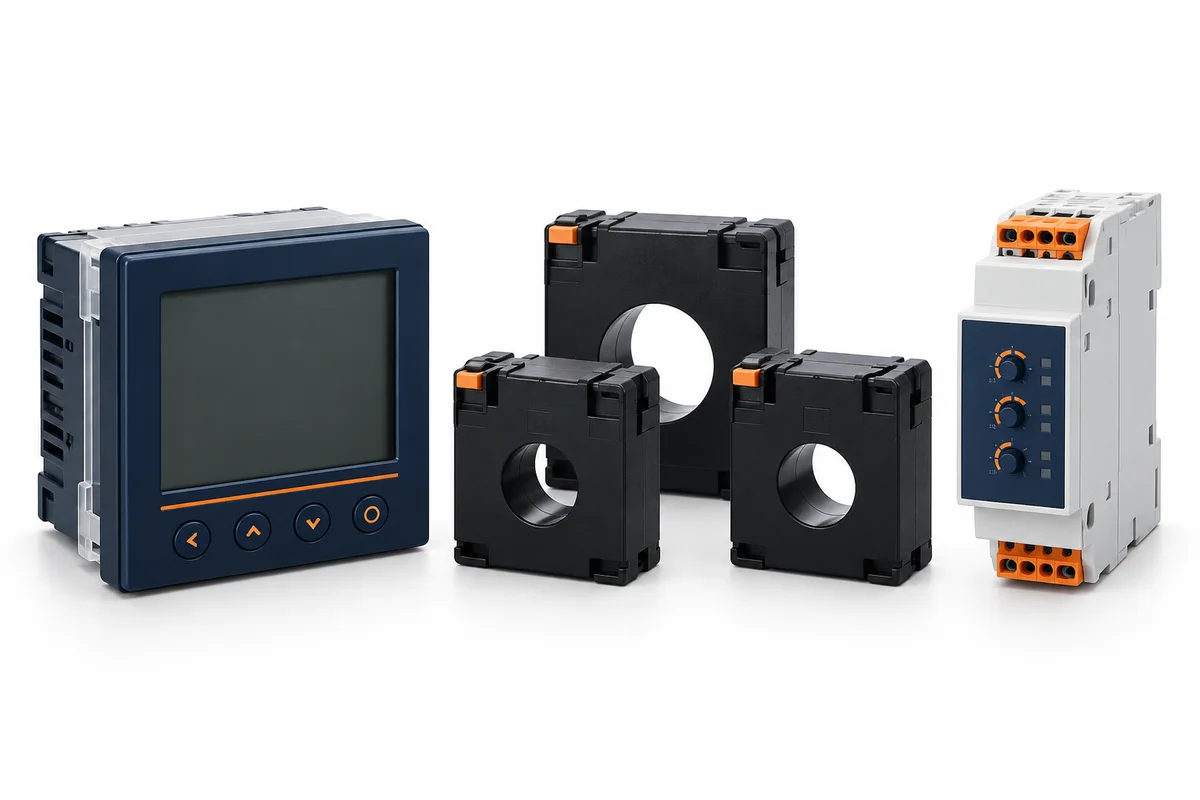
Start with the equipment duty. Add the control, protection and measurement functions that your project needs; these are options to review, not a pre-approved assembly.
Images are AI-generated illustrations of equipment categories, not LOVATO model photographs. Confirm dimensions and ratings from the selected model datasheet.
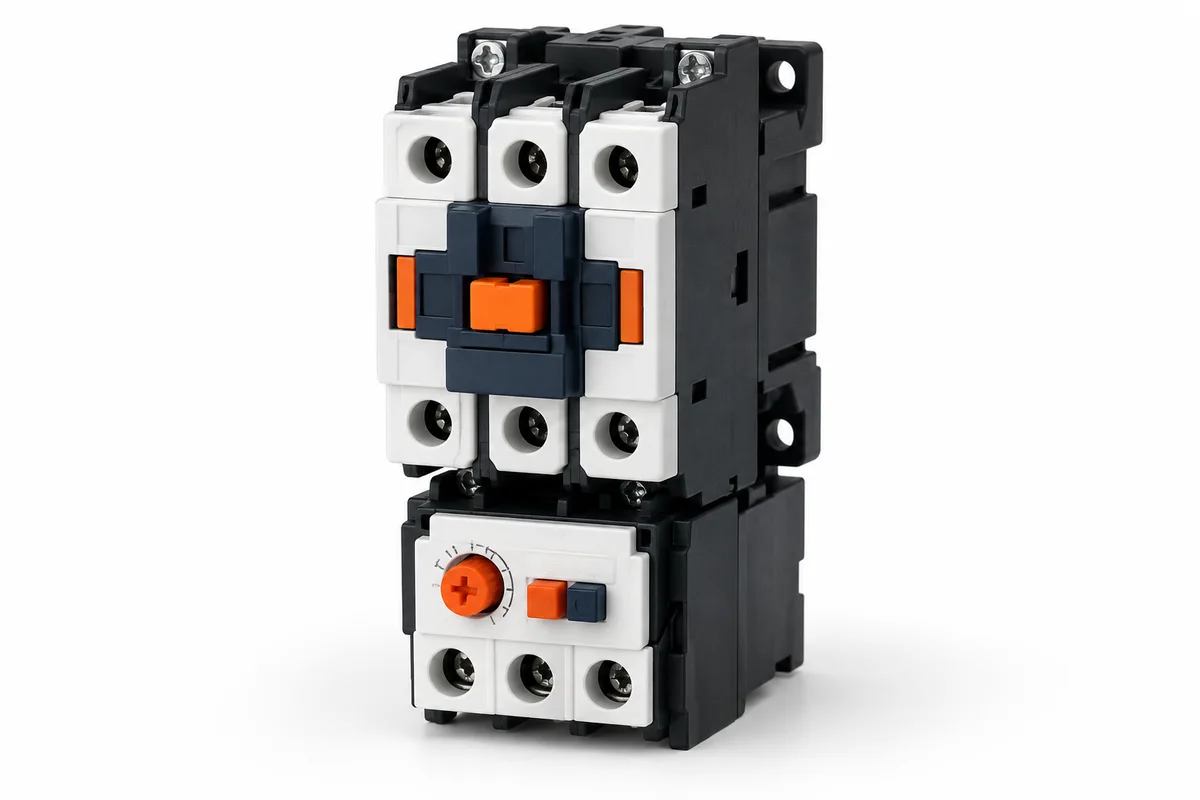
Motor protection & control
Switch motors or other loads using the appropriate utilisation category.
Confirm: Load type and duty · coil supply · auxiliary contacts.
Compare selection details ↗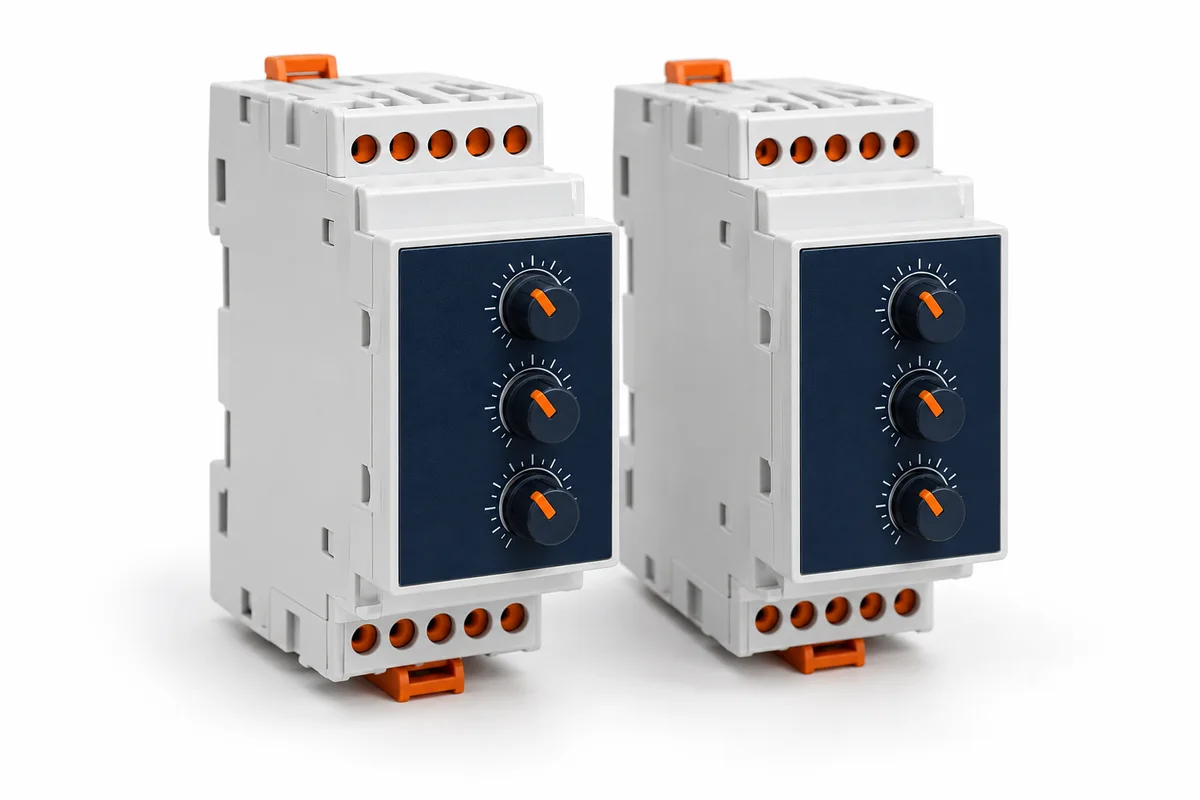
Motor protection & control
Monitor overload conditions within the motor protection scheme.
Confirm: Motor current · trip class · reset strategy.
Compare selection details ↗Automation & control
Interface control signals with suitable output contacts.
Confirm: Coil voltage · contact rating · socket and suppression.
Compare selection details ↗Automation & control
Budget the control-system DC demand and start-up requirements.
Confirm: Output voltage · continuous current · inrush and derating.
Compare selection details ↗Automation & control
Maintain compatible starter or control batteries.
Confirm: Battery chemistry · DC voltage · charge characteristics.
Compare selection details ↗Explore all 36 component families ↗
METHODS & WORKED EXAMPLES
These examples use the default inputs. Change the live controls above for your own scenario; the reference examples below remain fixed.
Annual kWh = rated shaft kW × load fraction × annual hours / efficiency fraction. Cost difference uses the entered energy tariff.
Technical reference: US Department of Energy: motor systems guide. This reference does not certify the website calculation or an NPE assembly.
Ideal secondary current = primary current × rated secondary / rated primary. This does not evaluate CT burden, accuracy or saturation.
Technical reference: Schneider Electric: current transformer guidance. This reference does not certify the website calculation or an NPE assembly.
METHODS & WORKED EXAMPLES
These examples use the default inputs. Change the live controls above for your own scenario; the reference examples below remain fixed.
Method reference: US DOE — Energy Management for Motor-Driven Systems