SOLUTIONS / APPLICATION GUIDE
Relays, monitoring & protection Identify the protection function and control circuit before choosing a relay. Convert CT currents and assemble the information needed for a coordination review.
AI-generated equipment illustration. CHOOSE YOUR APPROACH
Start with the application. Control and interface Confirm coil voltage, contact arrangement, switching category and load inrush.
Monitoring Define the voltage, phase, current or process condition and required response.
Protection Use a fault study and device curves to coordinate protection; do not guess pickup or time delay.
BUILD A USEFUL BRIEF
Bring these details. Relay model, function, supply and wiring diagram CT ratio, secondary rating, class and burden Protected equipment ratings and fault-level study Existing settings, trip circuit and test records Send your project brief ↗ Does the CT calculator provide relay settings? No. It converts ideal primary and secondary current. It does not evaluate CT saturation, burden, class, pickup or time coordination. Never open-circuit an energised CT secondary.
← Explore all application hubs
COMPONENTS THAT COMPLETE THE APPLICATION
Specify the whole working system. Start with the equipment duty. Add the control, protection and measurement functions that your project needs; these are options to review, not a pre-approved assembly.
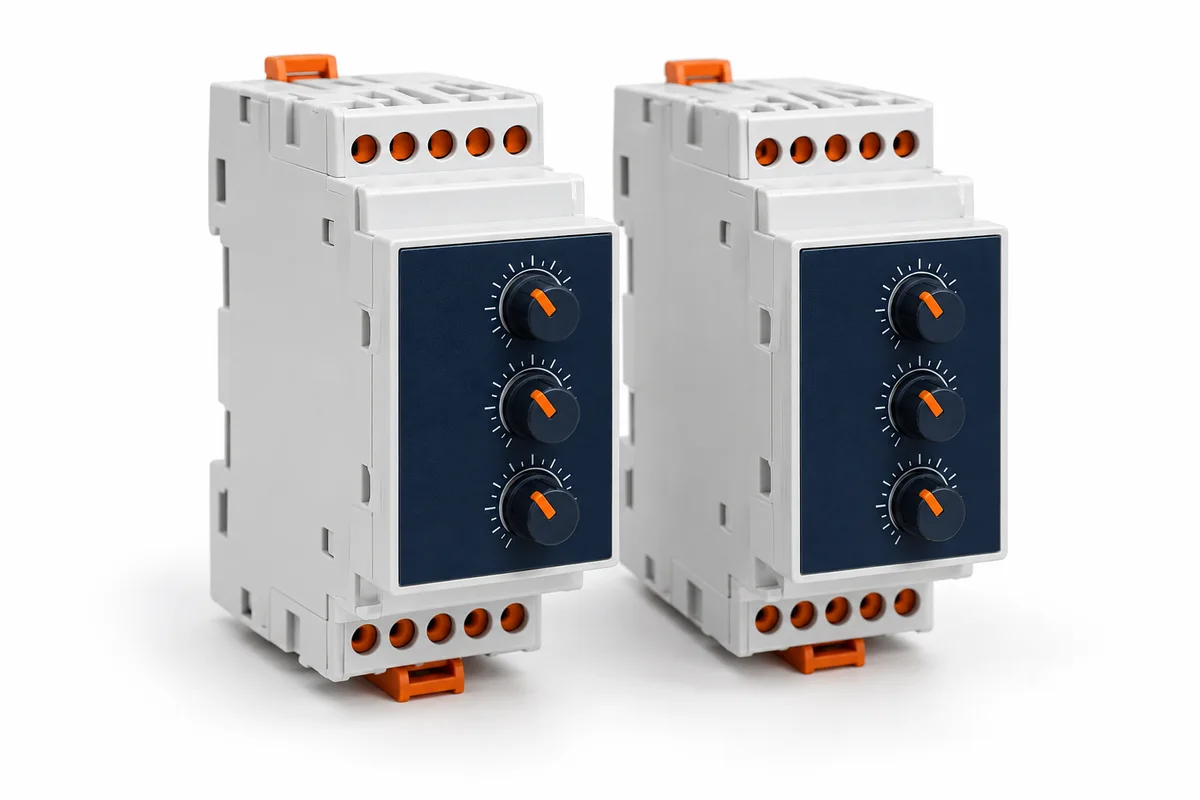
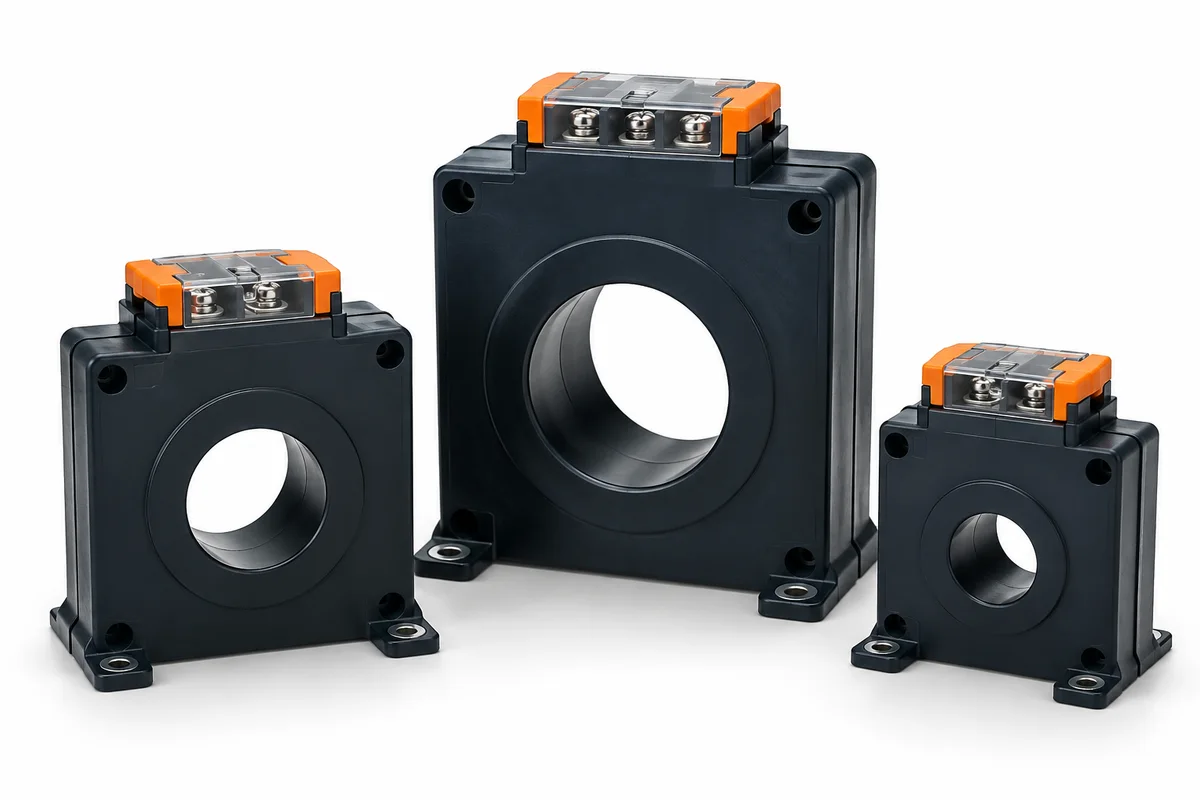
Images are AI-generated illustrations of equipment categories, not LOVATO model photographs. Confirm dimensions and ratings from the selected model datasheet.
Automation & control
Identify phase, voltage or current conditions that need an alarm or trip.
Confirm: Monitored quantity · operating window · reset behaviour.
Compare selection details ↗ Isolation & protection
Review earth-leakage monitoring within a coordinated protection scheme.
Confirm: Sensor compatibility · trip arrangement · selectivity.
Compare selection details ↗ Automation & control
Manage delays and sequencing in a defined control process.
Confirm: Timing function · control voltage · output duty.
Compare selection details ↗ Automation & control
Interface control signals with suitable output contacts.
Confirm: Coil voltage · contact rating · socket and suppression.
Compare selection details ↗ Motor protection & control
Consider electronic switching for suitable repetitive loads.
Confirm: Load waveform · heat dissipation · leakage current.
Compare selection details ↗ Energy management
Match sensing to the meter or protection application.
Confirm: Ratio and secondary · class and burden · conductor aperture.
Compare selection details ↗ Explore all 36 component families ↗
METHODS & WORKED EXAMPLES
Understand the estimate. These examples use the default inputs. Change the live controls above for your own scenario; the reference examples below remain fixed.
CT current conversion — worked example Ideal secondary current = primary current × rated secondary / rated primary. This does not evaluate CT burden, accuracy or saturation.
Example inputs CT rated primary: 400 A CT rated secondary: 5 A Primary current: 240 A Example result CT ratio: 80:1 Ideal secondary current: 3 A Primary rating utilisation: 60 % Assumptions & limits Isecondary = Iprimary × rated secondary / rated primary. Ideal ratio only; no allowance for saturation, phase error, accuracy class or burden. Never open-circuit an energised CT secondary. Protection settings require a coordination study and approved testing. Preliminary planning only. Final selection needs project-specific engineering verification. Technical reference: Schneider Electric: current transformer guidance . This reference does not certify the website calculation or an NPE assembly.
Short-circuit current — worked example Example inputs Transformer rating: 1000 kVA Impedance Z: 5 % Secondary voltage: 415 V — industrial Phase: 3Φ (three phase) Cable attenuation: 10 % Example result Transformer FLC: 1,391 A Prospective fault: 25 kA Breaking capacity: 36 kA Assumptions & limits Cable attenuation applied: 10 % Infinite upstream source assumed — utility contribution ignored Confirm the utility fault level with KPLC before finalising ratings Preliminary planning only. Final selection needs project-specific engineering verification. kVA ↔ amps — worked example Example inputs Value: 500 Conversion: kVA → amps Phase: 3Φ (three phase) System voltage: 415 V — industrial Power factor: 0.8 Example result Line current: 696 A Apparent power: 500 kVA Active power: 400 kW Assumptions & limits Phase system: 3Φ balanced at 415 V Multiplier used: √3 × V Assumes a balanced, linear load profile Preliminary planning only. Final selection needs project-specific engineering verification. METHODS & WORKED EXAMPLES
Understand the estimate. These examples use the default inputs. Change the live controls above for your own scenario; the reference examples below remain fixed.
DC control power budget — worked example Example inputs DC output voltage: 24 V DC PLC and other continuous load: 25 W Simultaneously held DC coils: 6 Holding power per DC coil: 3 W Simultaneous sensors: 10 Power per sensor: 0.5 W Reserve allowance: 25 % Example result Connected continuous load: 48 W Budget with reserve: 60 W DC output current budget: 2.5 A Assumptions & limits Pload = PLC / other W + coil count × holding W + sensor count × sensor W. Pbudget = Pload × (1 + reserve / 100); Ibudget = Pbudget / DC voltage. Reserve is a planning assumption, not a manufacturer requirement. All listed loads must match the selected DC voltage. AC coil VA and DC coil watts are not interchangeable. Check coil pull-in peaks, simultaneous starting, temperature and altitude derating, overload behaviour and branch protection separately. This tool does not select a supply model. Preliminary planning only. Final selection needs project-specific engineering verification. Method reference: MEAN WELL — Power supply selection FAQ
Three-phase voltage unbalance — worked example Example inputs L1–L2 voltage: 415 V L2–L3 voltage: 410 V L3–L1 voltage: 420 V Example result Average line voltage: 415 V Maximum deviation: 5 V Voltage unbalance: 1.2 % Assumptions & limits Unbalance (%) = 100 × maximum absolute deviation from the average / average. Use line-to-line readings taken under the same operating condition. No pass/fail limit or trip delay is selected. Check equipment limits and investigate supply conditions with a qualified engineer. This method uses voltage magnitudes only; it is not an IEC negative-sequence calculation. Preliminary planning only. Final selection needs project-specific engineering verification. Method reference: US DOE — Energy Management for Motor-Driven Systems